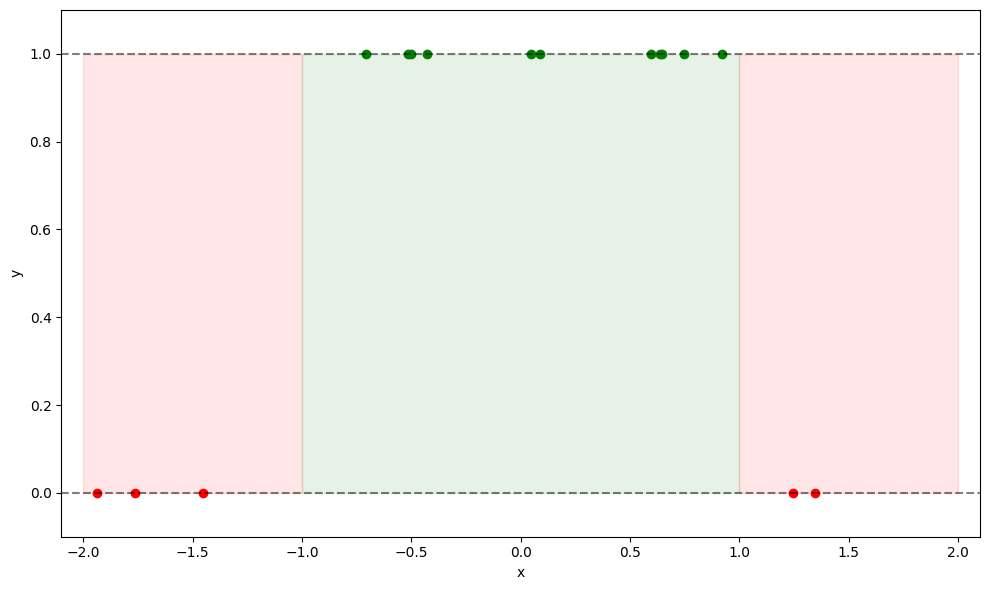
fig, ax = plt.subplots(figsize=(10, 6))
ax.scatter(samples[true_inds], labels[true_inds], c='g', label='True')
ax.scatter(samples[false_inds], labels[false_inds], c='r', label='False')
#ax.plot(domain_arr, true_function(domain_arr), c='k', label='True Function')
#ax.plot(domain_arr, heuristic_func(domain_arr), c='b', label='Heuristic Function', alpha=0.75, ls='--')
ax.axhline(0, color='k', ls='--', alpha=0.5)
ax.axhline(1, color='k', ls='--', alpha=0.5)
ax.fill_betweenx([0, 1], -1, 1, color='g', alpha=0.1)
ax.fill_betweenx([0, 1], -2, -1, color='r', alpha=0.1)
ax.fill_betweenx([0, 1], 2, 1, color='r', alpha=0.1)
ax.set(xlabel='x', ylabel='y', ylim=[-0.1, 1.1], xlim=[-2.1, 2.1])
plt.tight_layout()
plt.savefig('heuristic_function_1.png', dpi=300)
plt.show()
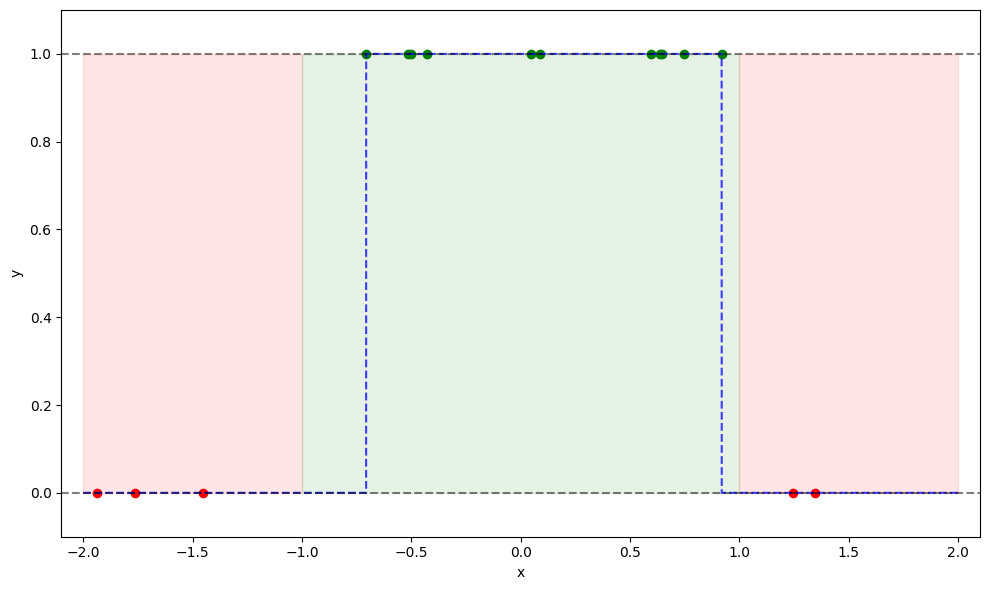
fig, ax = plt.subplots(figsize=(10, 6))
ax.scatter(samples[true_inds], labels[true_inds], c='g', label='True')
ax.scatter(samples[false_inds], labels[false_inds], c='r', label='False')
#ax.plot(domain_arr, true_function(domain_arr), c='k', label='True Function')
ax.plot(domain_arr, good_heuristic_func(domain_arr), c='b', label='Heuristic Function', alpha=0.75, ls='--')
ax.axhline(0, color='k', ls='--', alpha=0.5)
ax.axhline(1, color='k', ls='--', alpha=0.5)
ax.fill_betweenx([0, 1], -1, 1, color='g', alpha=0.1)
ax.fill_betweenx([0, 1], -2, -1, color='r', alpha=0.1)
ax.fill_betweenx([0, 1], 2, 1, color='r', alpha=0.1)
ax.set(xlabel='x', ylabel='y', ylim=[-0.1, 1.1], xlim=[-2.1, 2.1])
plt.tight_layout()
plt.savefig('heuristic_function_2.png', dpi=300)
plt.show()
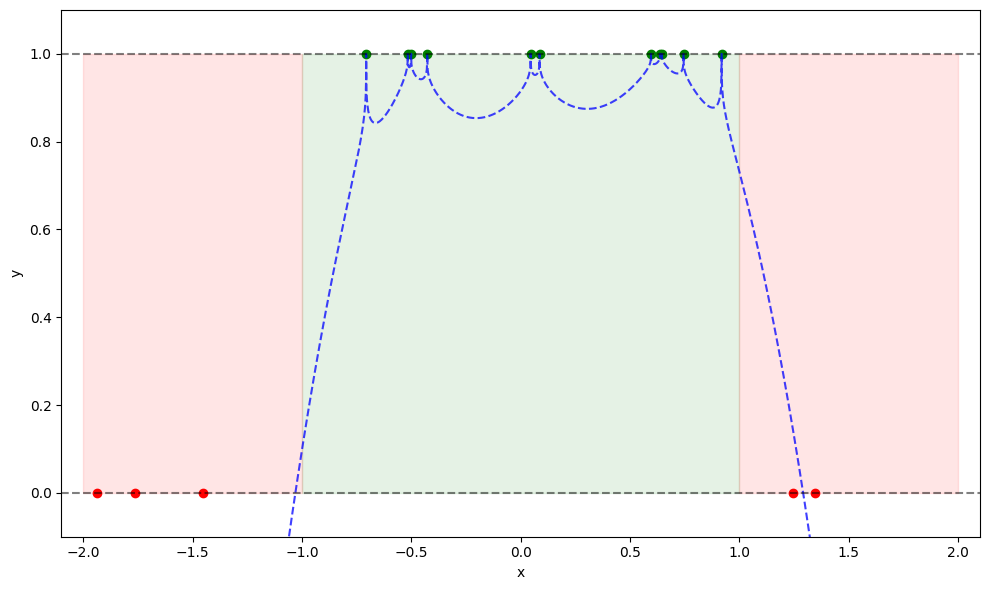
fig, ax = plt.subplots(figsize=(10, 6))
ax.scatter(samples[true_inds], labels[true_inds], c='g', label='True')
ax.scatter(samples[false_inds], labels[false_inds], c='r', label='False')
#ax.plot(domain_arr, true_function(domain_arr), c='k', label='True Function')
ax.plot(domain_arr, heuristic_func(domain_arr), c='b', label='Heuristic Function', alpha=0.75, ls='--')
ax.axhline(0, color='k', ls='--', alpha=0.5)
ax.axhline(1, color='k', ls='--', alpha=0.5)
ax.fill_betweenx([0, 1], -1, 1, color='g', alpha=0.1)
ax.fill_betweenx([0, 1], -2, -1, color='r', alpha=0.1)
ax.fill_betweenx([0, 1], 2, 1, color='r', alpha=0.1)
ax.set(xlabel='x', ylabel='y', ylim=[-0.1, 1.1], xlim=[-2.1, 2.1])
plt.tight_layout()
plt.savefig('heuristic_function_3.png', dpi=300)
plt.show()